
Analysis: Land Allocation & Population Disparity in Manipur
Land allocation disparity
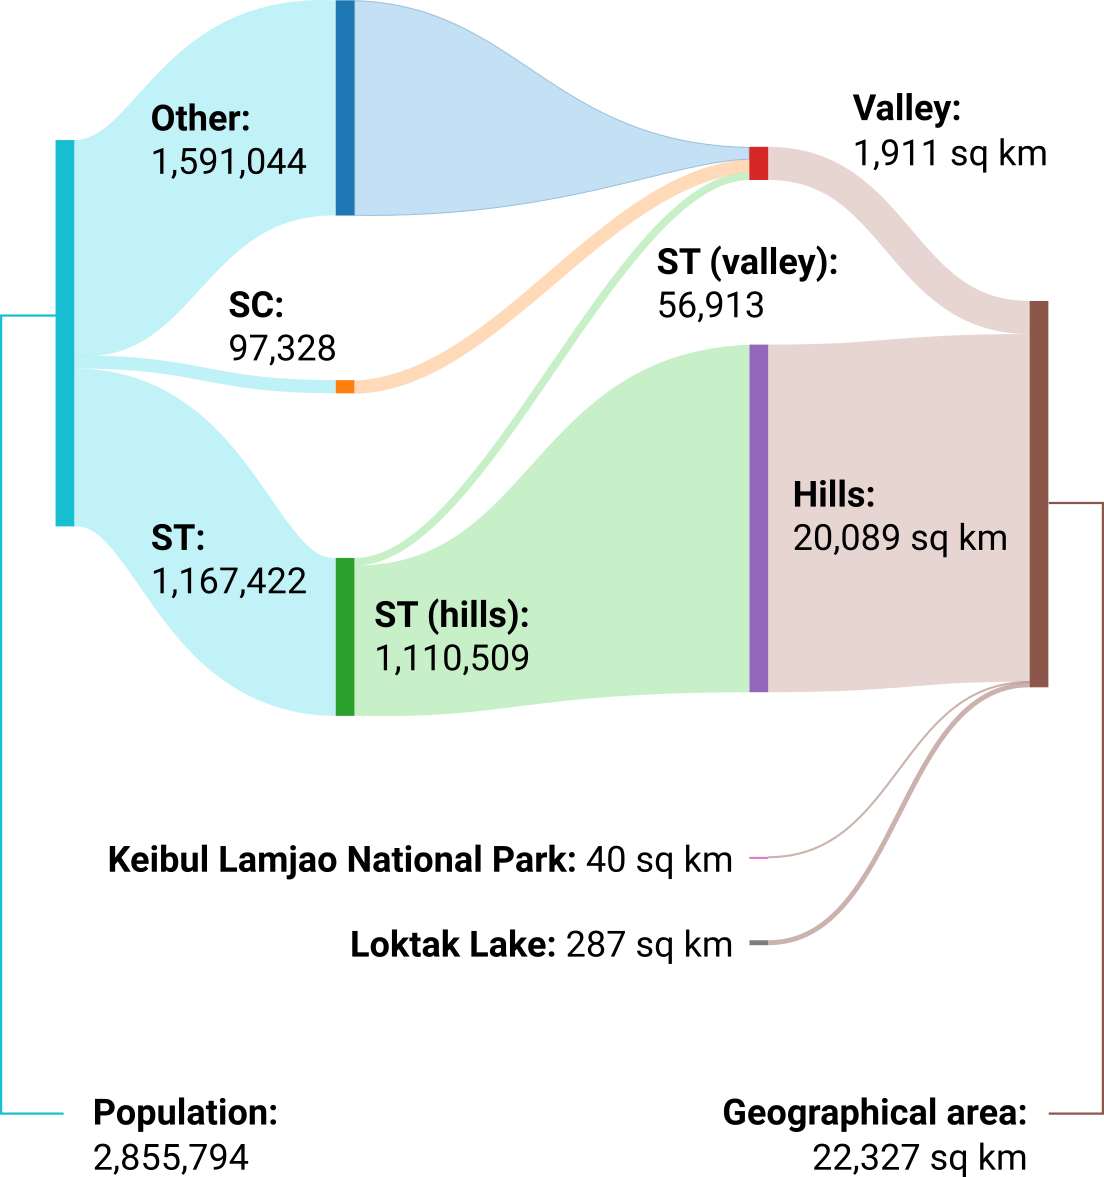
The following shows a Sankey diagram mapping a population of 2,855,794 (as of 2011) to a geographical area of 22,327 square kilometres (as of 2021). For the year 2023, we are looking at over 3.6 million persons within the same geographical area.
We have not separated out forested areas and other regions that may be considered uninhabitable.
Land distribution
The following shows the geographical land distribution between the districts of Manipur.
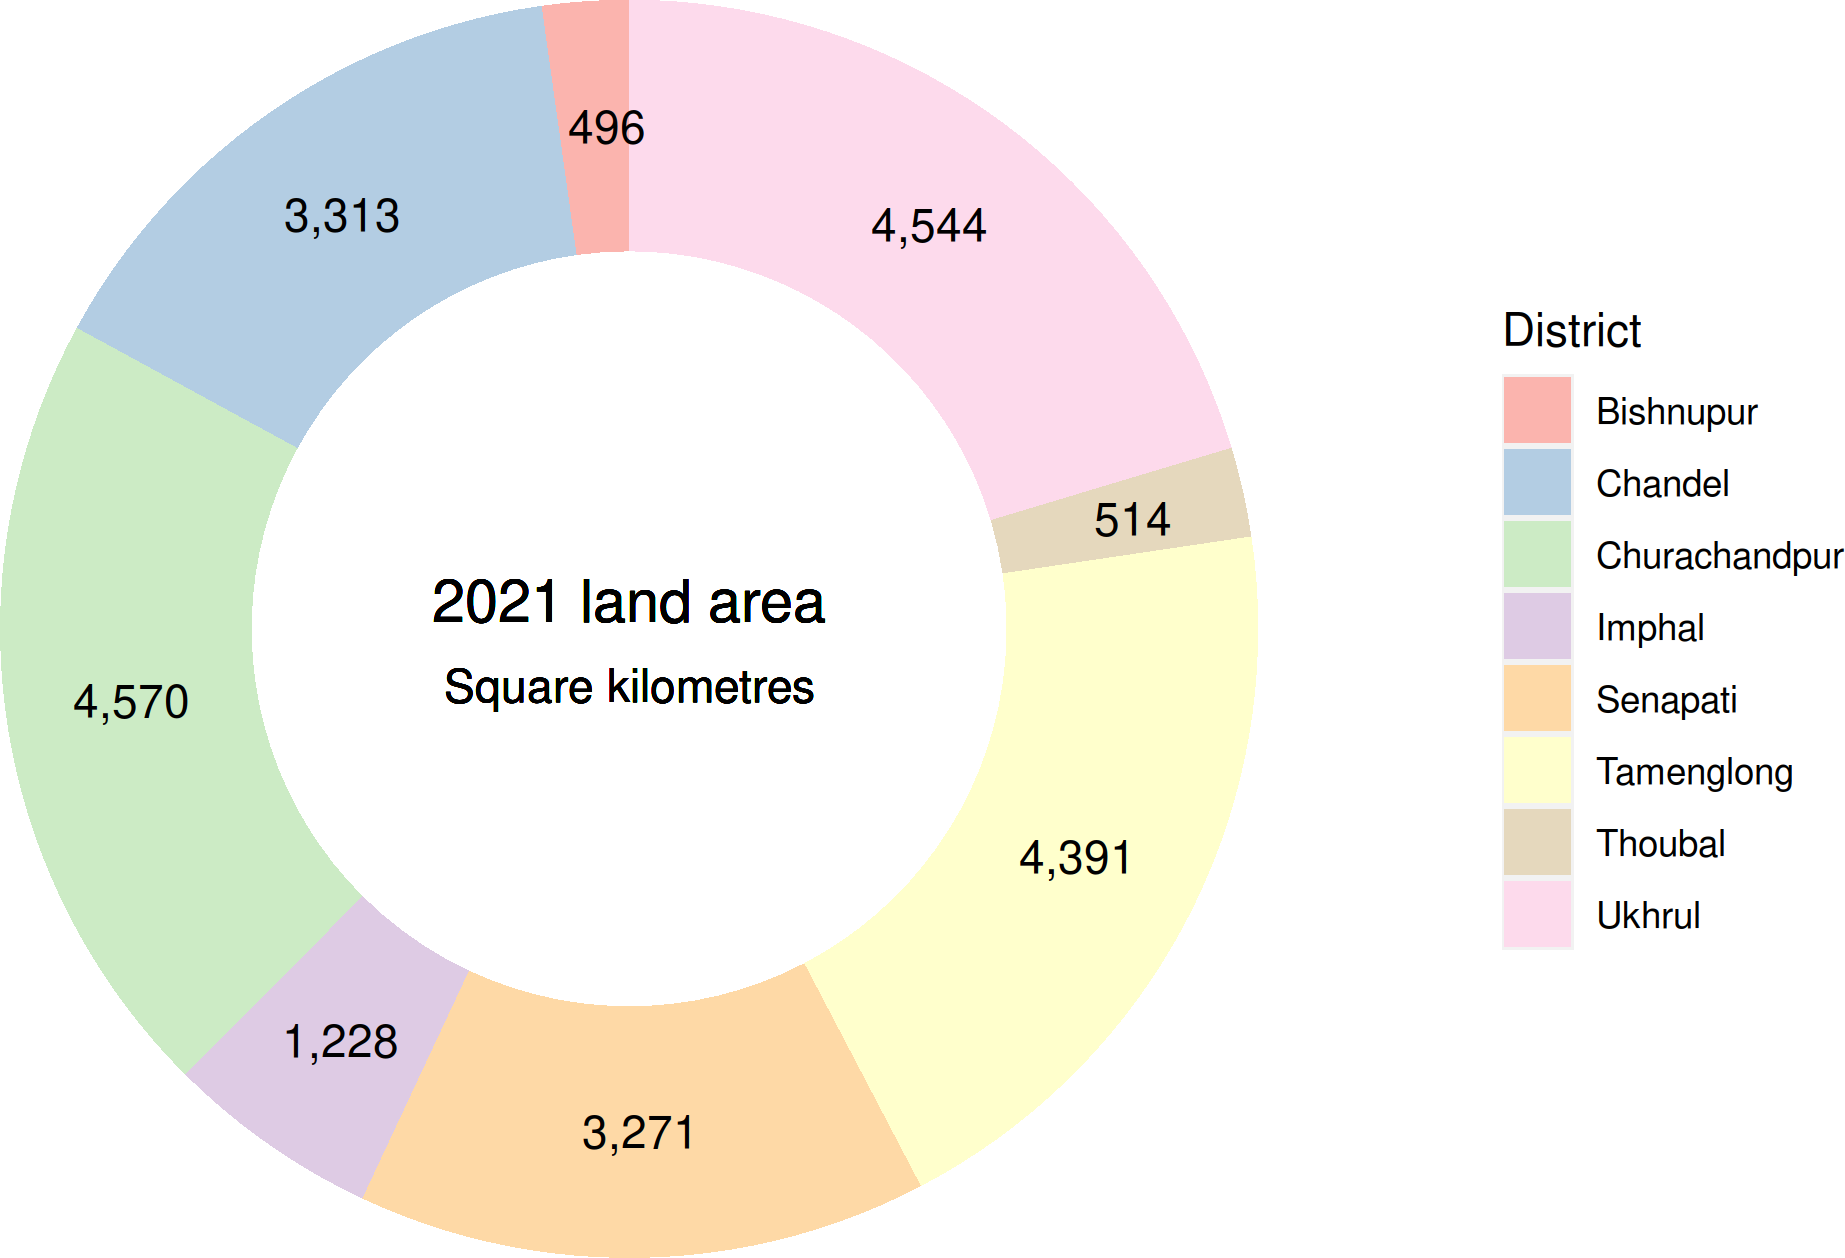
Data from the India State of Forest Report 2021, pages 387–394, published by the Forest Survey of India, Ministry of Environment, Forest and Climate change, ISBN: 978-81-950073-1-18, Website: http://fsi.nic.in/forest-report-2021-details
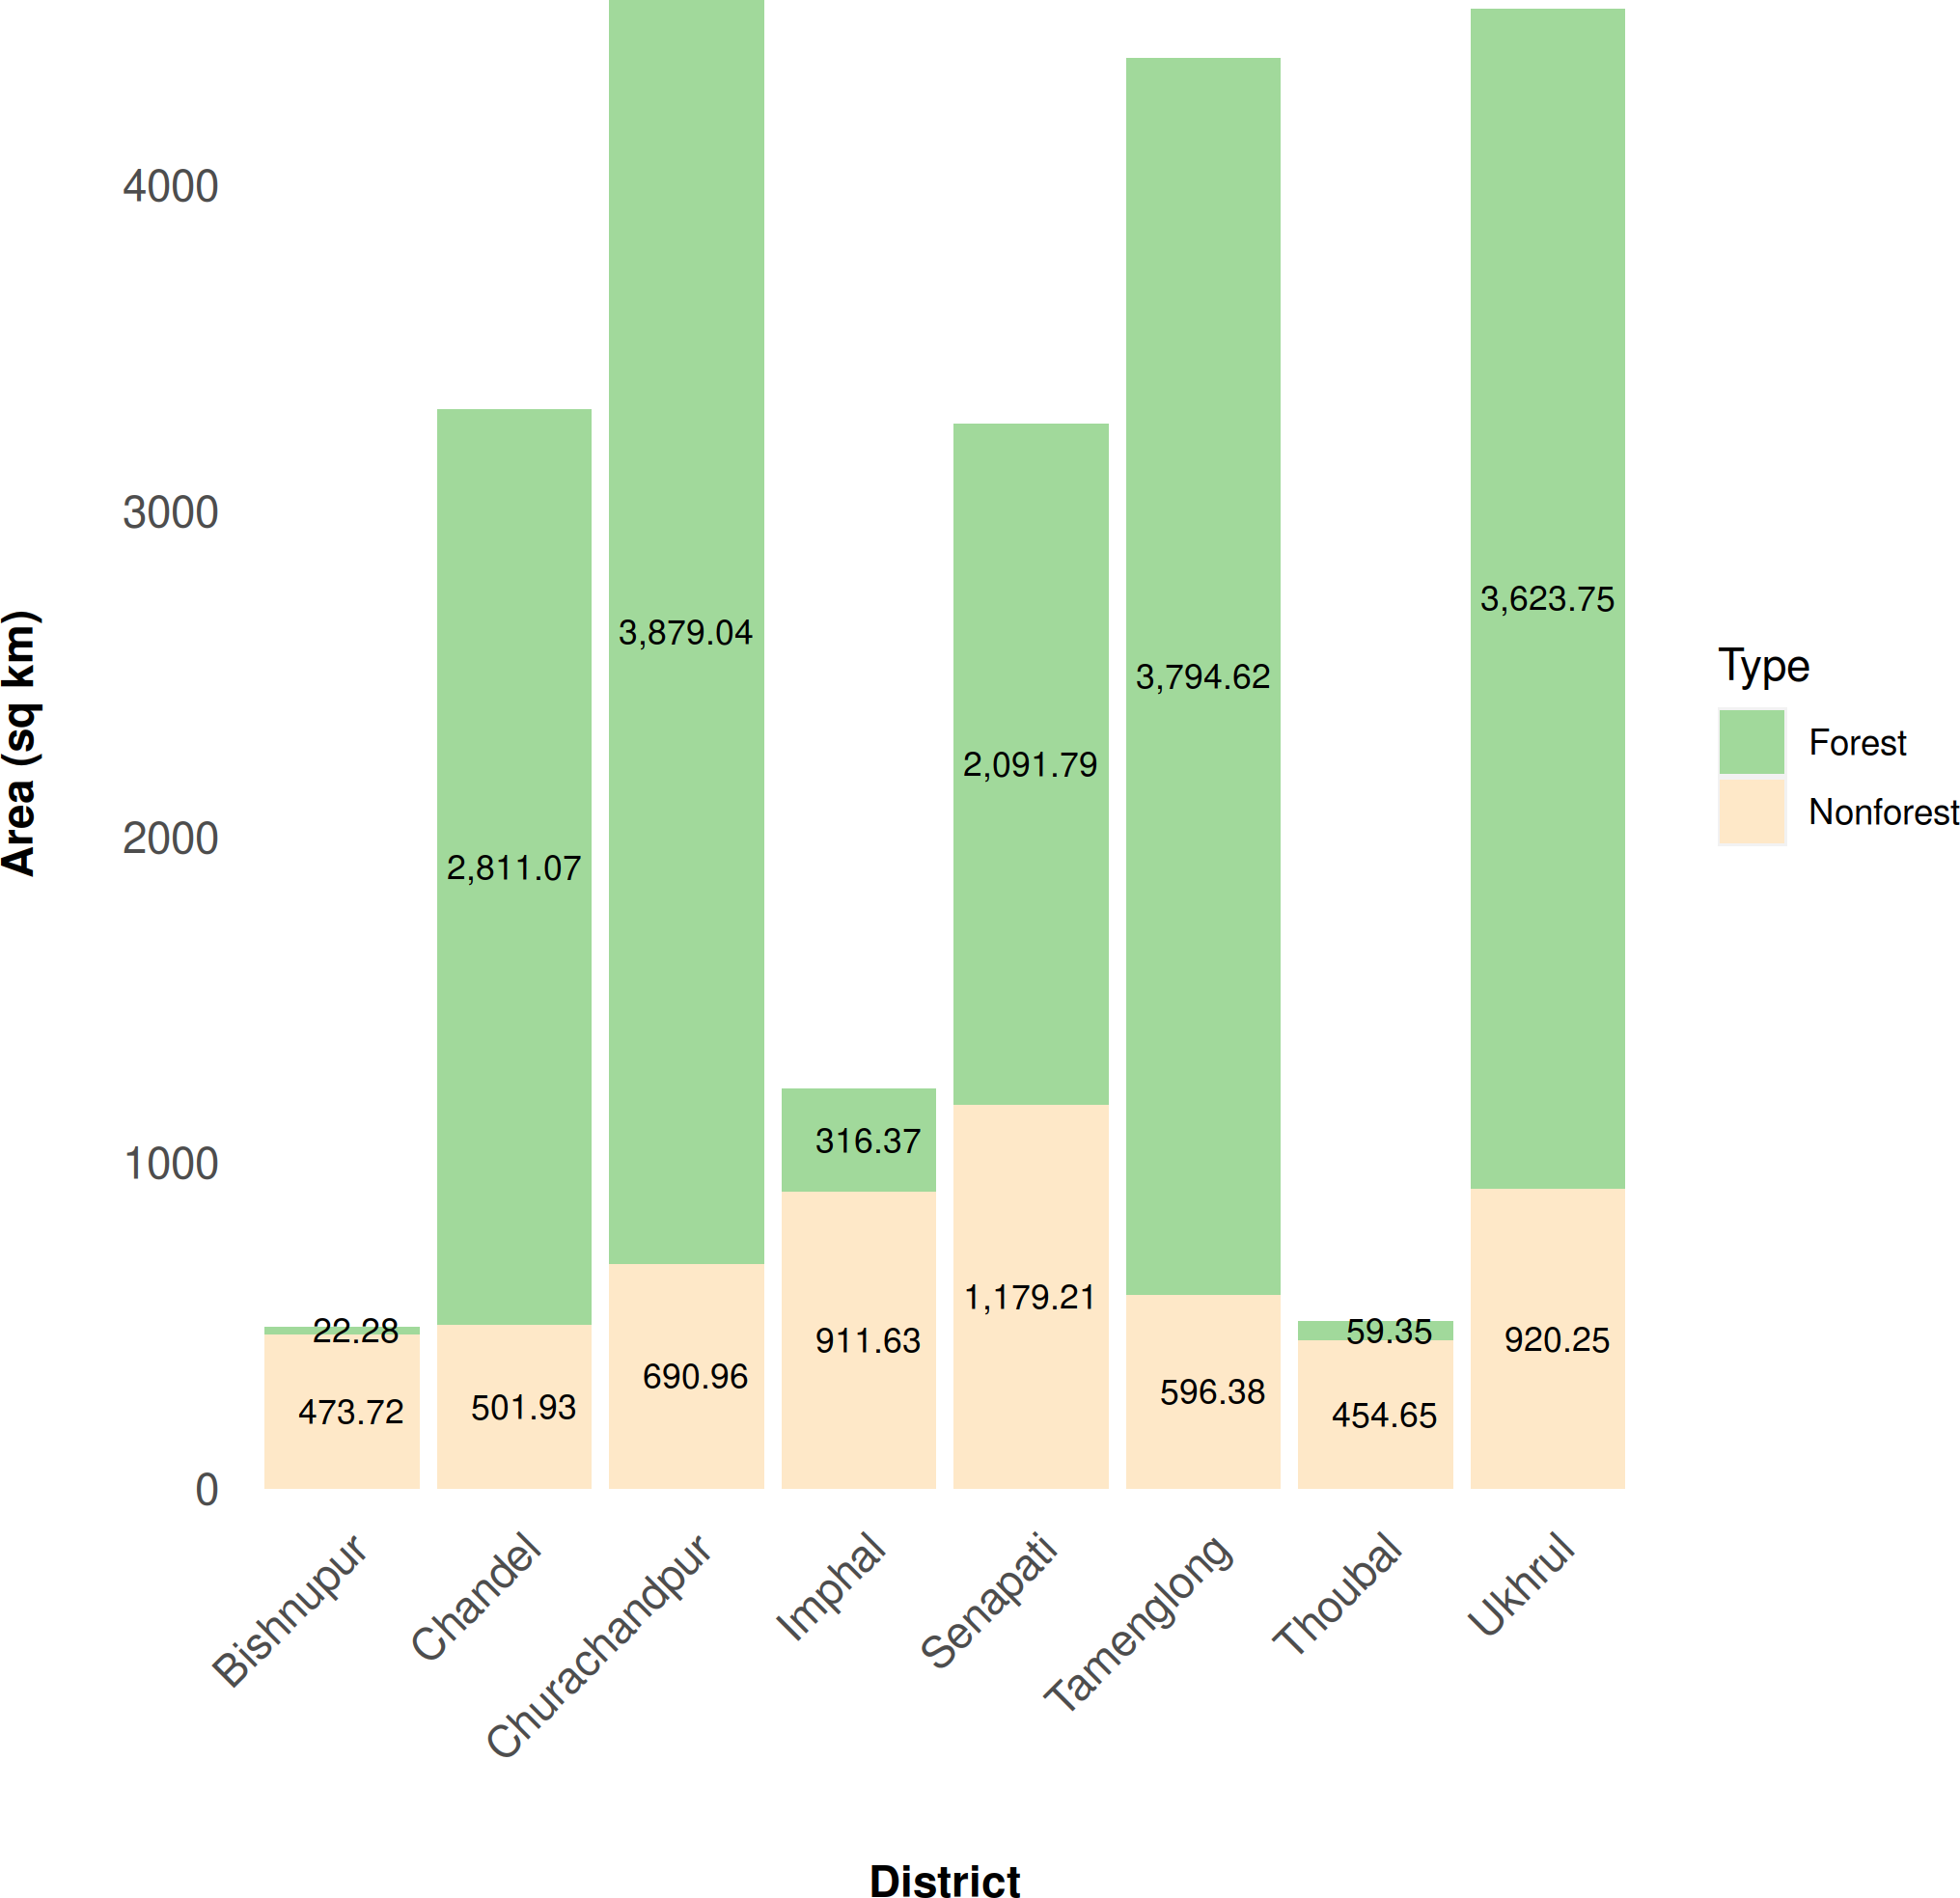
The above shows distribution between forested and non-forested areas.
We have combined the land areas for newer districts (e.g., Imphal East and Imphal West) so that the combined land area is usable when calculating population densities from 1991 onwards (before new districts were created).
Scheduled Tribe privileges
Under the Fifth Schedule of the Indian Constitution, the Scheduled Tribes (ST) are allowed to own land in the hilly region. These are scheduled land protected under the rights of scheduled tribes by the Indian constitution. However, scheduled tribes are also allowed to own and occupy land in the valley, and once owned by a scheduled tribe, valley land ownership may not be easily transferred to a non-ST individual.
Scheduled Castes (SC) mostly own and occupy land in the valley, but few reside in the hilly regions.
Other ethnic groups are only allowed to own and occupy land in the valley.
This is a serious concern for other ethnicities who are not protected, since the valley is already overpopulated.
Projected valley overpopulation
According to the 2022 UN World Population Prospectus, the forecast average population density of India for 2021, 2031 and 2041 as projected by the United Nations are respectively 428, 464 and 492 persons per square kilometre.
Following table shows the estimated population densities (persons per sq km) for 2021, 2031 and 2041 for each district of Manipur based on extrapolated population forecast, and using land area for each district as reported in the 2021 forest survey.
This table shows density relative to non-forested land assuming that non-forest land is inhabitable, which is normally not the case (e.g., land use due to cultivation, roads, rivers and lakes).
| District | Non-forested Area (sq km) | 2021 | 2031 | 2041 |
|---|---|---|---|---|
| Bishnupur | 146.72 | 1,856.87 | 2,127.35 | 2,437.23 |
| Chandel | 501.93 | 417.25 | 583.40 | 815.72 |
| Churachandpur | 690.96 | 498.42 | 620.06 | 771.38 |
| Imphal | 911.63 | 1,252.87 | 1,465.57 | 1,714.38 |
| Senapati | 1,179.21 | 598.74 | 988.17 | 1,630.88 |
| Tamenglong | 596.38 | 301.77 | 384.92 | 490.98 |
| Thoubal | 454.65 | 1,120.89 | 1,340.57 | 1,603.31 |
| Ukhrul | 920.25 | 259.14 | 336.47 | 436.89 |
The three districts: Bishnupur, Imphal, and Thoubal are informally referred to as the Valley; whereas, the remaining districts are referred to as the Hills. However, we believe that Manipur as a whole should be considered all Hills since the average elevation of the Valley is 790 metres above mean sea level (832.2 metres in the north, and 760.01 metres in the south).
The following shows population density relative to total geographical land area for each district. For Bishnupur, area covered by the Loktak Lake (287 sq km) and Keibul Lamjao National Park (40 sq km) have been excluded before calculating the densities.
| District | Geographical Area (sq km) | 2021 | 2031 | 2041 |
|---|---|---|---|---|
| Bishnupur | 169 | 1,612.07 | 1,846.89 | 2,115.92 |
| Chandel | 3,313 | 63.21 | 88.39 | 123.58 |
| Churachandpur | 4,570 | 75.36 | 93.75 | 116.63 |
| Imphal | 1,228 | 930.09 | 1,087.99 | 1,272.70 |
| Senapati | 3,271 | 215.85 | 356.24 | 587.94 |
| Tamenglong | 4,391 | 40.99 | 52.28 | 66.68 |
| Thoubal | 514 | 991.46 | 1,185.78 | 1,418.18 |
| Ukhrul | 4,544 | 52.48 | 68.14 | 88.48 |
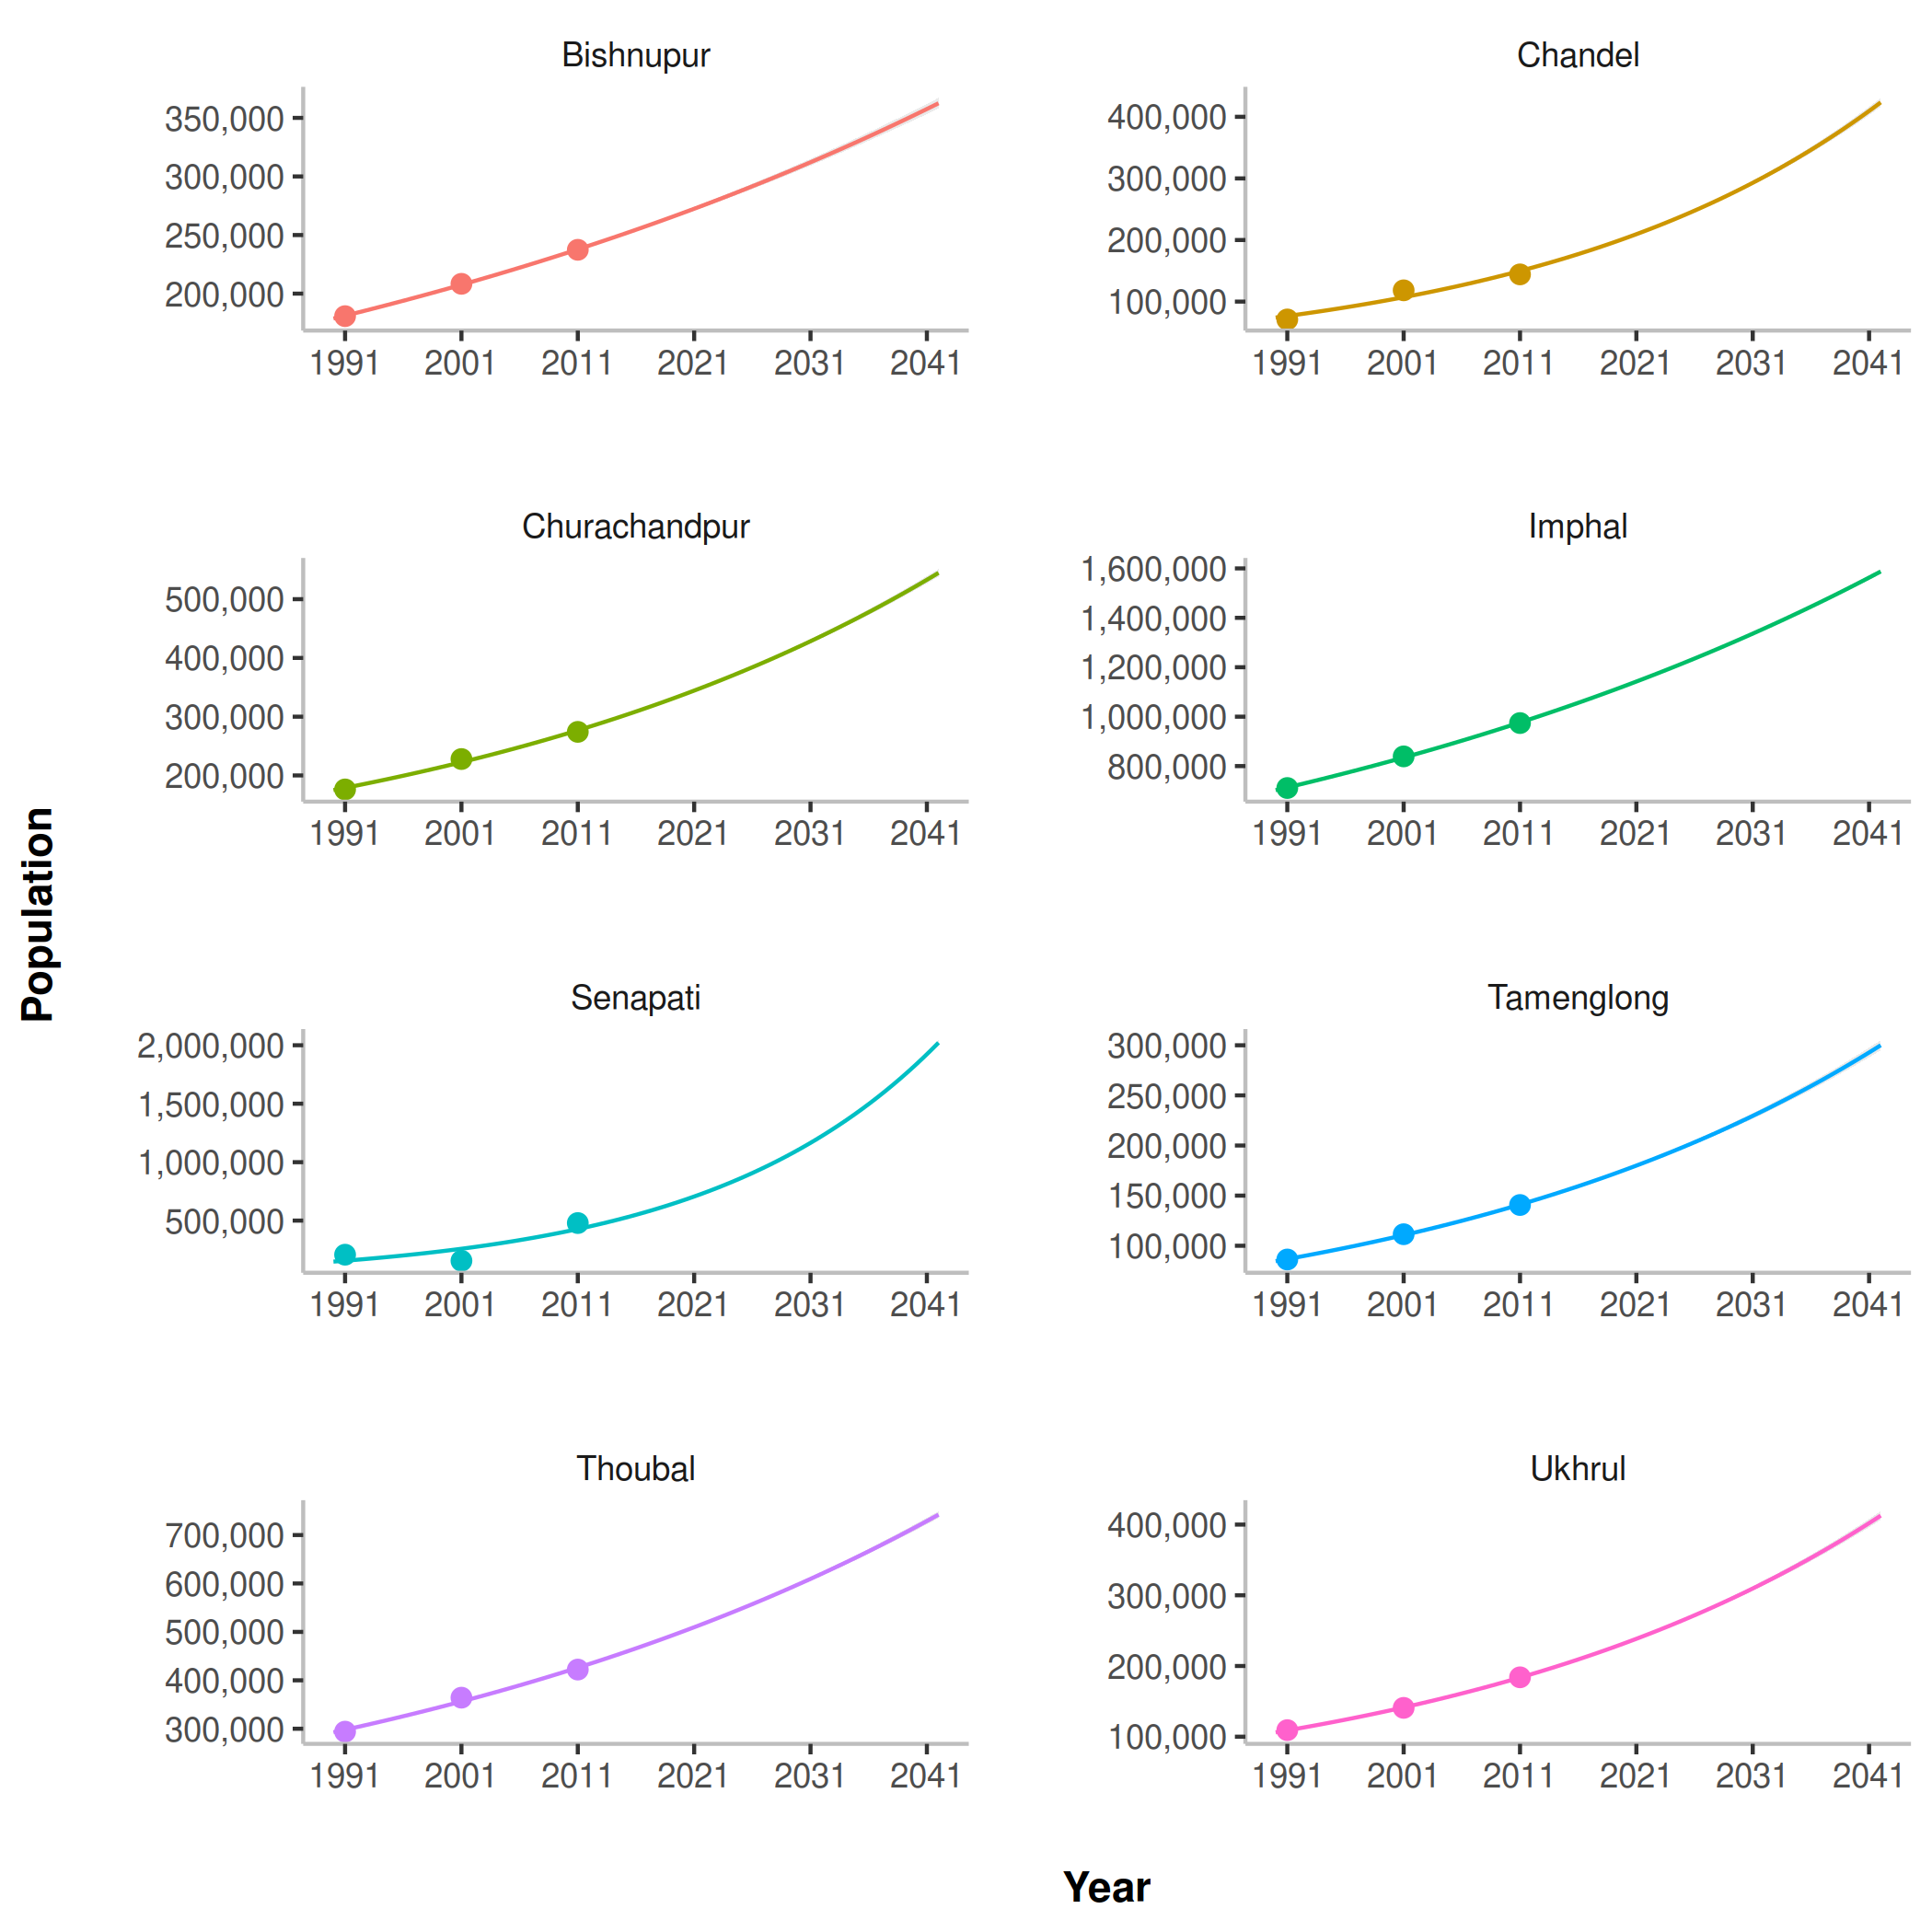
Population forecast
Following shows the regression lines used to extrapolate populations for 2021, 2031 and 2041 for each district based on the census data from 1991, 2001 and 2011. We fit a generalised linear model using Poisson family with log link. Please note that the Senapati data is anomalous (see Anomalous population growth).
The projected populations for 2021, 2031 and 2041 are:
| District | 2021 | 2031 | 2041 |
|---|---|---|---|
| Bishnupur | 272,440 | 312,125 | 357,591 |
| Chandel | 209,429 | 292,827 | 409,435 |
| Churachandpur | 344,392 | 428,438 | 532,996 |
| Imphal | 1,142,153 | 1,336,057 | 1,562,880 |
| Senapati | 706,043 | 1,165,257 | 1,923,145 |
| Tamenglong | 179,969 | 229,558 | 292,809 |
| Thoubal | 509,612 | 609,491 | 728,946 |
| Ukhrul | 238,472 | 309,639 | 402,044 |
| Total | 3,602,510 | 4,683,392 | 6,209,846 |
The estimated populations for 1991, 2001 and 2011 using the same regression line that we used for the extrapolations are:
| District | 1991 | 2001 | 2011 |
|---|---|---|---|
| Bishnupur | 181,174 | 207,565 | 237,800 |
| Chandel | 76,615 | 107,125 | 149,783 |
| Churachandpur | 178,873 | 222,526 | 276,832 |
| Imphal | 713,547 | 834,686 | 976,391 |
| Senapati | 157,058 | 259,209 | 427,800 |
| Tamenglong | 86,720 | 110,615 | 141,093 |
| Thoubal | 297,891 | 356,274 | 426,101 |
| Ukhrul | 108,939 | 141,450 | 183,662 |
| Total | 1,800,817 | 2,239,450 | 2,819,462 |
The actual populations for 1991, 2001 and 2011 as recorded in the census by the Government of India are:
| District | 1991 | 2001 | 2011 |
|---|---|---|---|
| Bishnupur | 180,773 | 208,368 | 237,399 |
| Chandel | 71,014 | 118,327 | 144,182 |
| Churachandpur | 176,184 | 227,905 | 274,143 |
| Imphal | 711,261 | 839,258 | 974,105 |
| Senapati | 208,406 | 156,513 | 479,148 |
| Tamenglong | 86,278 | 111,499 | 140,651 |
| Thoubal | 293,958 | 364,140 | 422,168 |
| Ukhrul | 109,275 | 140,778 | 183,998 |
| Total | 1,837,149 | 2,166,788 | 2,855,794 |
Anomalous population growth
For the 1991 and 2001 census data, the population count for sub-divisions in Senapati district are missing. Population count for Purul is missing from both 1991 and 2001 census data; whereas, data for Mao-Maram, Paomata, and Saitu Gamphazol are missing in the 2001 census data. These are marked explicitly in the Excel documents supplied by the Government of India (data sources listed below).
We have been unable to ascertain the reason for this missing population count. Furthermore, we are unable to understand the significant jump (marked in red) in population count for Mao-Maram, even after due consideration is given to the missing data. This population growth rate is anomalous.
| Sub-division | 1991 | 2001 | 2011 |
|---|---|---|---|
| Mao-Maram | 49,902 | - | 163,380 |
| Paomata | 41,435 | - | 53,901 |
| Purul | - | - | 68,123 |
| Sadar Hills East | 40,036 | 51,438 | 63,364 |
| Sadar Hills West | 77,033 | 60,945 | 71,844 |
| Saitu Gamphazol | 44,130 | - | 58,536 |
Data Sources
The following are the population data files provided by the Government
of India (https://censusindia.gov.in/).
-
2011 Census
-
2001 Census
-
1991 Census
-
Land area data taken from the India State of Forest Report 2021, pages 387–394, published by the Forest Survey of India, Ministry of Environment, Forest and Climate change, ISBN: 978-81-950073-1-18, Website: http://fsi.nic.in/forest-report-2021-details.